Profiling with Intel VTune™#
This page describes how to enable ITT tracing and analyze performance of Intel® Deep Learning Streamer (Intel® DL Streamer) and GStreamer elements using Intel VTune™ tool.
Note
Intel VTune™ uses ITT interface to capture custom tasks and visualize them on Profile tab. ITT instrumentation is enabled in default
builds of Intel® DL Streamer, oneTBB, OpenCL intercept-layer, and some other libraries, but disabled by default in binary releases of
OpenVINO™ toolkit. Please refer to wiki page
for instructions how to build OpenVINO™ toolkit from sources and additionally pass -DENABLE_PROFILING_ITT=ON option to cmake in configuration step.
More details about ITT instrumentation in OpenVINO™ toolkit can be found on
documentation page
1. Install VTune™#
The preferable way of using VTune™ is Windows-to-Linux remote profiling/analysis method.
First, download and install VTune™ using following link https://www.intel.com/content/www/us/en/developer/tools/oneapi/vtune-profiler-download.html
Choose the Online Installer option.
2. Configure VTune™ host platform, Windows-to-Linux remote profiling method#
Open VTune™ and create new project (or just Configure Analysis)
Setup configuration in three panes WHERE, WHAT, HOW
For pane WHERE configuration, please see: https://www.intel.com/content/www/us/en/develop/documentation/vtune-help/top/set-up-analysis-target/linux-targets/remote-linux-target-setup/configuring-ssh-access-for-remote-collection.html
For pane WHAT configuration, please create a script on target-Linux system like below.
Please modify the command parameter in the script.
#!/bin/bash
command="$@"
#e.g. command="gst-launch-1.0 filesrc location=<VIDEO_FILE> ! decodebin3 ! gvainference model=<MODEL>.xml ! fakesink sync=false"

# OpenVINO™ Toolkit environment
source /opt/intel/openvino_2024/setupvars.sh

# Intel® DL Streamer environment
source /opt/intel/dlstreamer/gstreamer/setupvars.sh
source /opt/intel/dlstreamer/setupvars.sh

# Run VTune™ collector
$command
Set Application path pointing the above script
Update advanced options: ensure check-box
Analyze child processesis set.For pane HOW configuration, selects “Hotspots” or other Accelerators analysis
Press start button to execute your pipeline and collect performance snapshot.
3. Results Analysis#
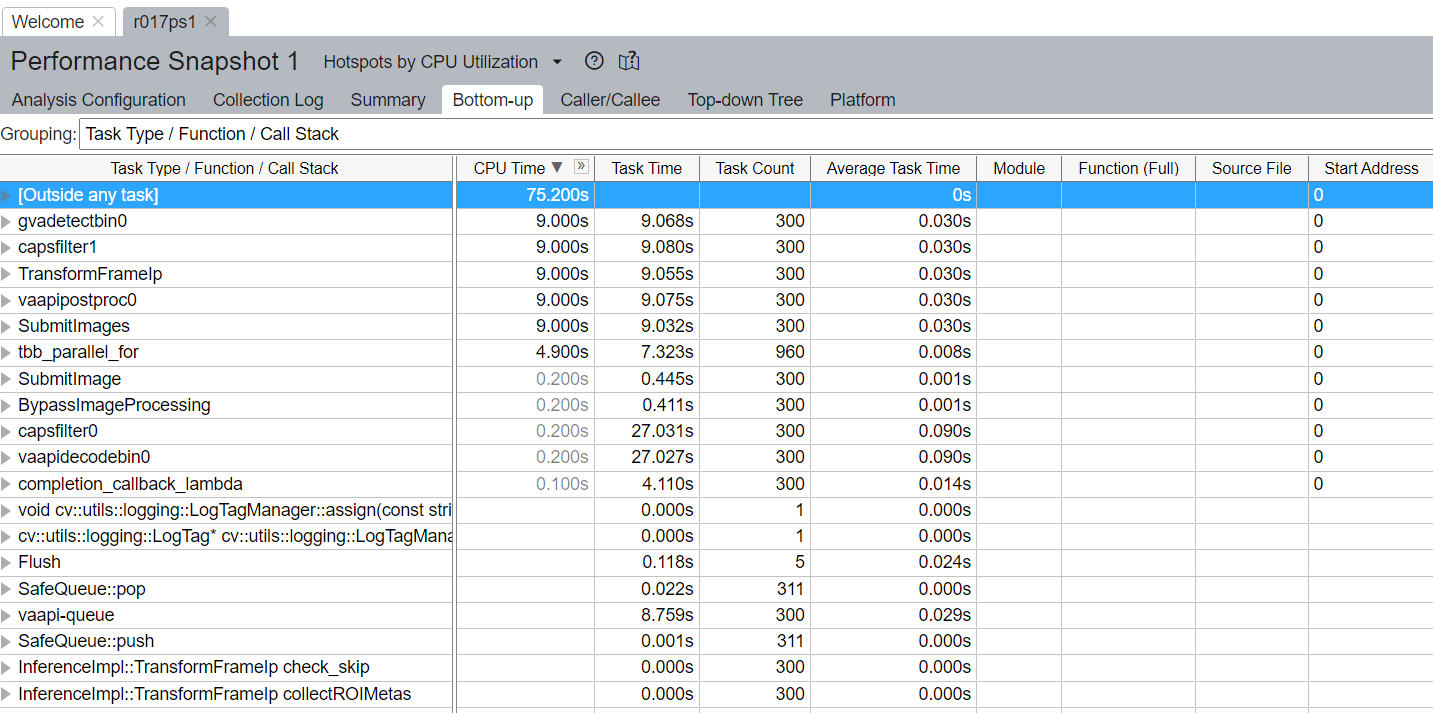
When results is ready you can check Bottom-UP tab (Grouping “Task Type / Function / Call stack”) to check how much time each task takes and how many times it was called.
For example on screenshot below we can see whole pipeline duration was 75.2s (including models load step). Inference (gvadetect) in general took 9.068s of whole pipeline execution and was called 300 times (Because input media filed had 300 frames.). 4.110s of this inference was taken by Inference completion callback (completion_callback_lambda) where DLStreamer processes inference results from OV. And about 0.445s for Submitting image. So it means the remaining time 9.068 - 4.110 - 0.445 = 4.513s was taken by executing inference inside OV.
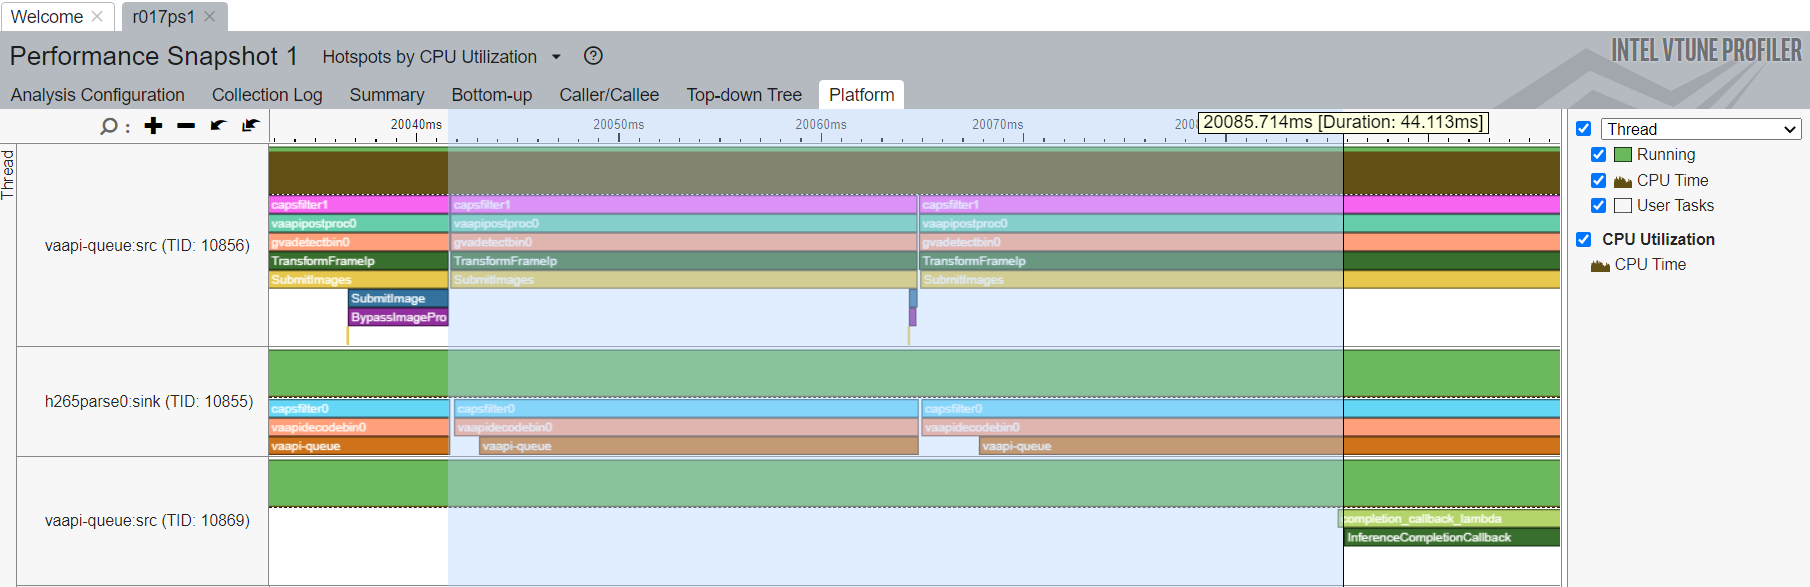
Also you can check platform tab to see detailed calls graph and measure each methods call time.
For example on screenshot below shown how to measure first OpenVINO™ Toolkit inference time: the time from first Submit image till first completion callback call.